Sandbox
Brand, Culture and Digital Transformation
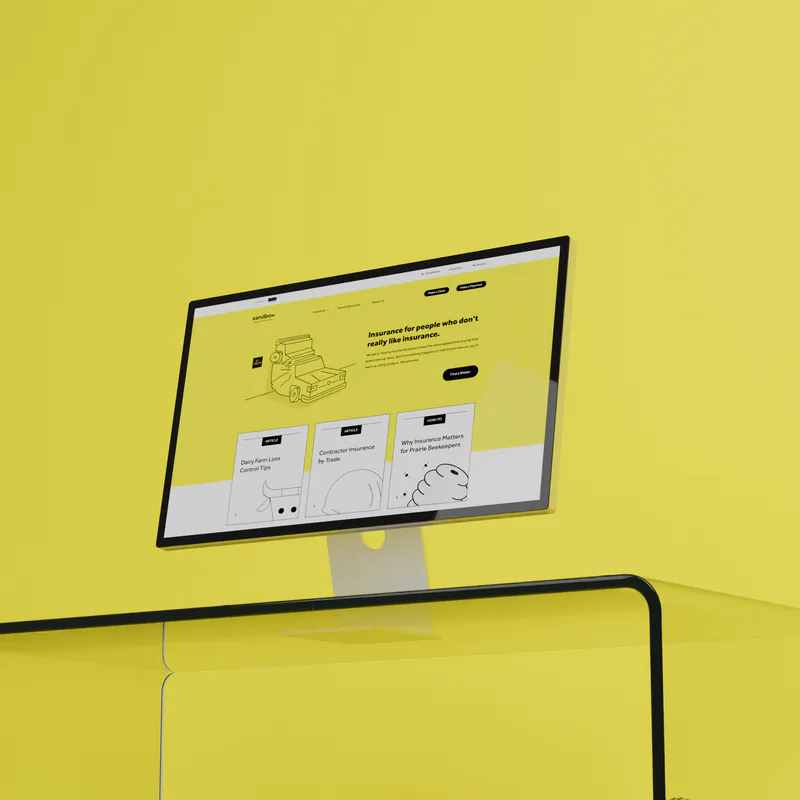
End-to-end transformation, modernizing a 100-year-old insurer's entire employee, customer and broker experience.
We’re proud of the work we deliver for our clients. From complex websites to custom web apps, we’ve embarked on some ambitious projects with tough challenges and high expectations, and we’ve found success together.
Sandbox
End-to-end transformation, modernizing a 100-year-old insurer's entire employee, customer and broker experience.
“
zu took us from another insurance company that nobody has heard of to a brand that people are actually asking about. Since our new launch, everything has been trending in the right direction, from recognition, employee buy-in, digital adoption and overall sales performance
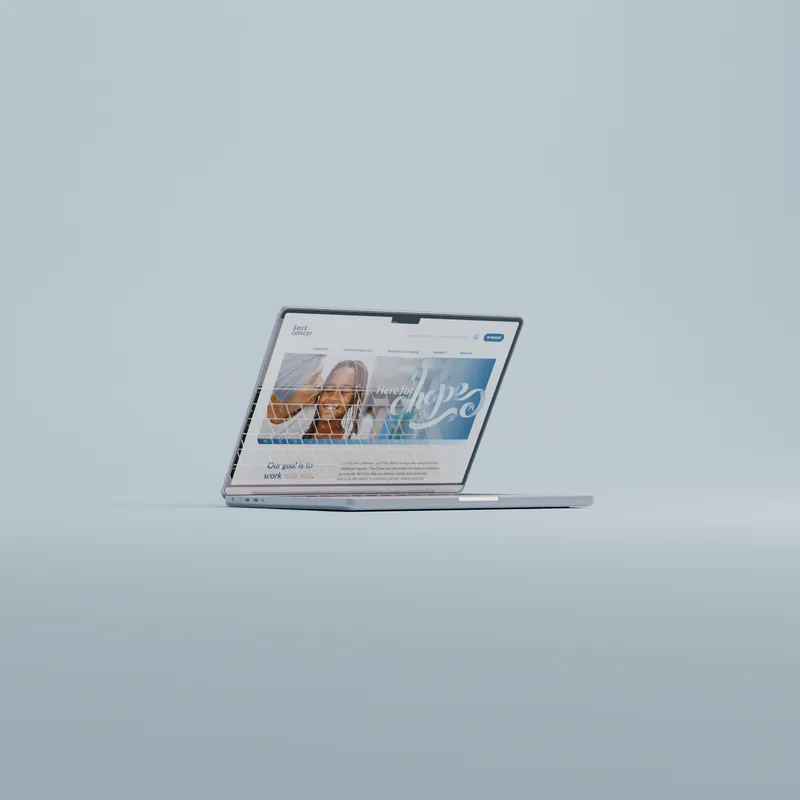
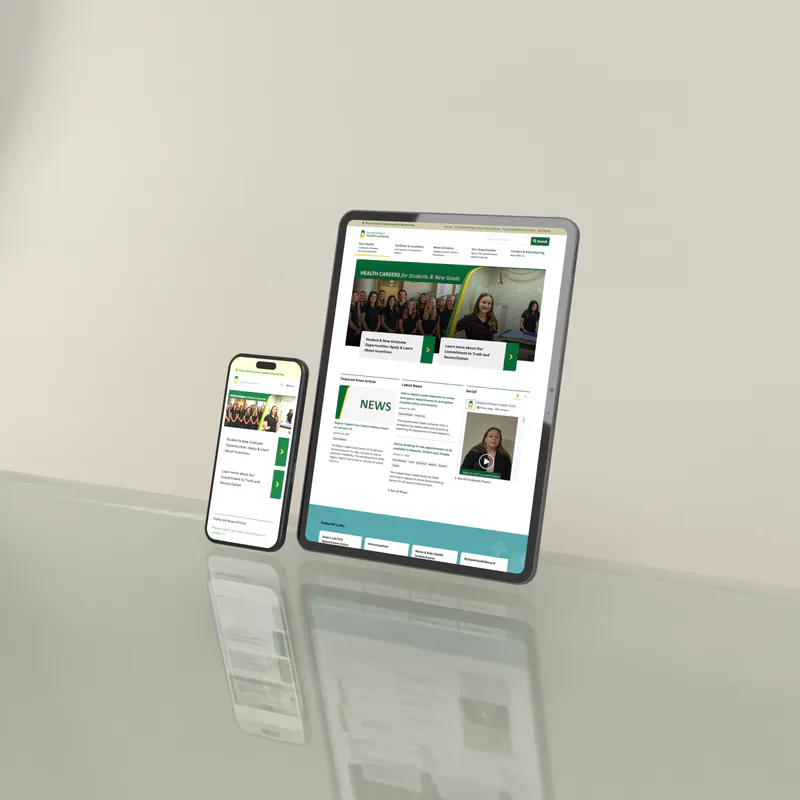
Saskatchewan Cancer Agency
Patient-first website focused on accessibility, clarity, and supportive user experiences.
“
We truly value our partnership with zu. Their collaborative, user-centred approach keeps our team focused, nimble, and competitive at a national level. They’re seasoned at navigating the complex, large-scale digital work, all while making the process enjoyable.
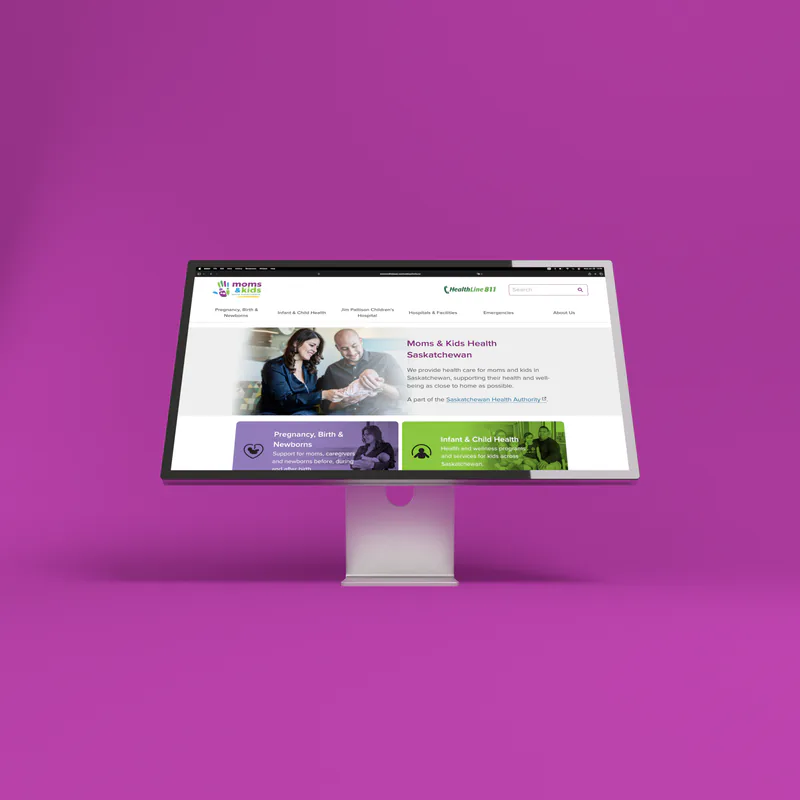
Moms & Kids Health Saskatchewan
Maternal and Child Programs of Saskatchewan was a bit of a mouthful, so we redesigned it for clarity & support.
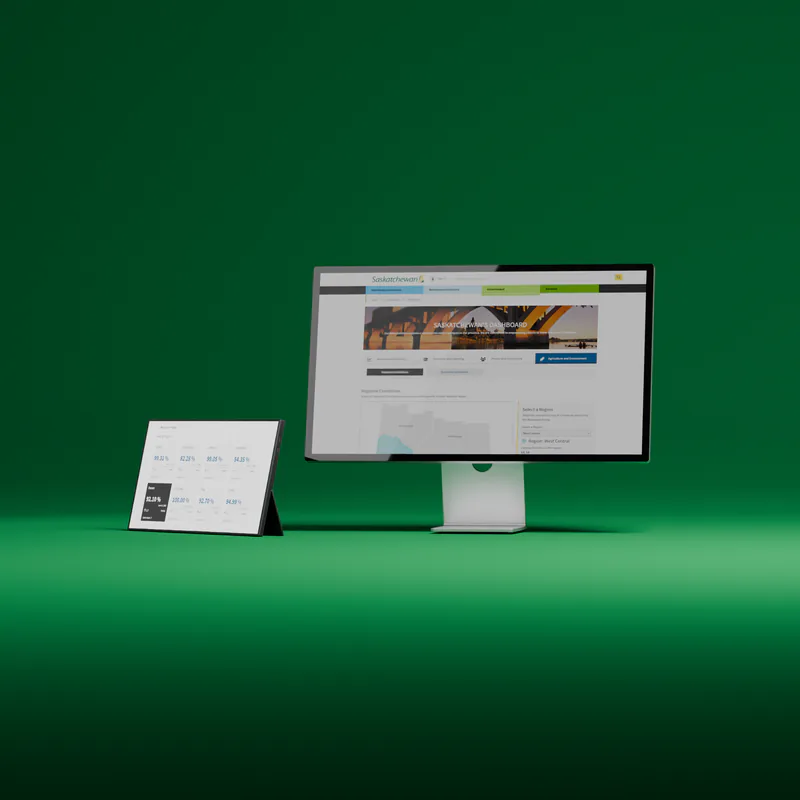
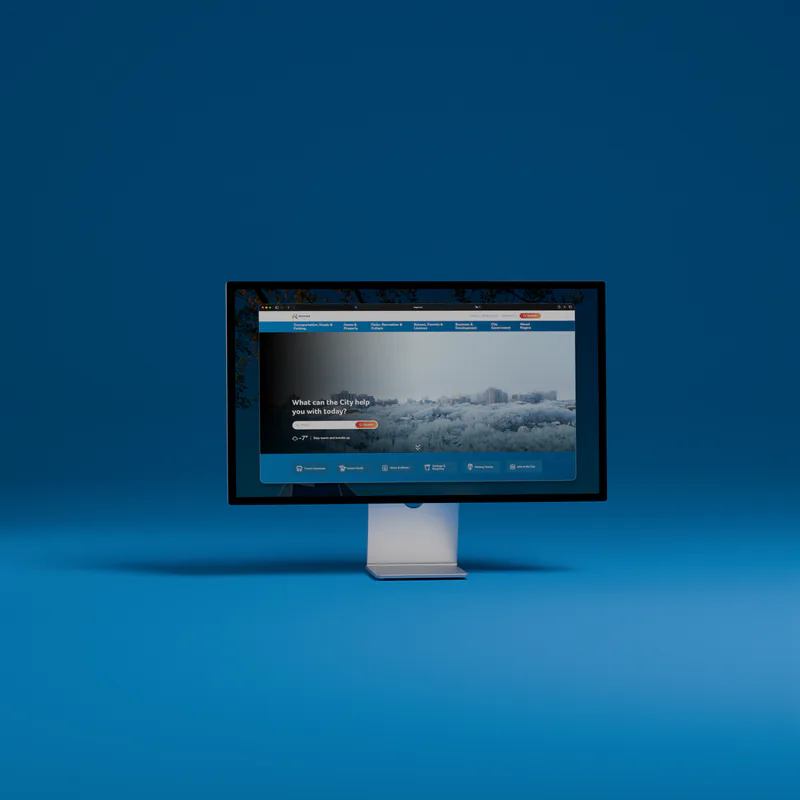
Government of Saskatchewan
Increasing public-sector transparency for citizens through a unified dashboard spanning six ministries.
“
The Dashboard has become a vital, always-on source of information, updated seven days a week and scaled far beyond its original intent. zu is highly responsive to our evolving data, quickly integrating new indicators and adapting the platform to handle increasing complexity at every step.
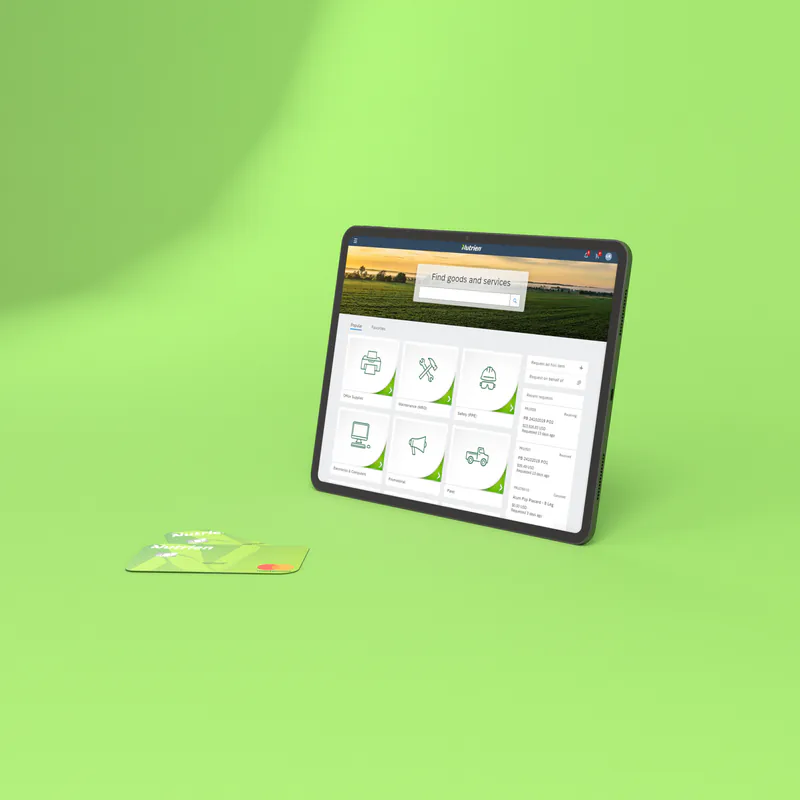
Farm Credit Canada
A technology-agnostic engagement focused on inspiring customer obsession, user-experience principles, and design leadership within Canada’s largest agriculture lending institution.
Government of Saskatchewan
A 15-year partnership delivering native apps, dashboards, and digital platforms that serve students, citizens, newcomers, and civil servants across multiple ministries and public programs.
Conexus Credit Union
Reimagining the digital experience and designing a member-first website that reflects the values, ambition, and progressive vision of Saskatchewan’s most personal credit union.
Government of Saskatchewan
Modernizing legislative document management through a custom web and mobile platform that streamlines collaboration, improves accessibility, and supports effective governance workflows.
Saskatchewan Polytechnic
A full website redesign focused on simplifying navigation and information architecture so students, faculty, and staff can find what they need faster and with less friction.
Government of Saskatchewan
Comprehensive UX strategy for the Ministry of Advanced Education’s student portal, delivering accessibility-led improvements grounded in research, design, and real student needs.
Following Their Voices
Building a web platform that supports Indigenous student success by enabling feedback-driven insights to help improve outcomes and First Nations graduation rates.
SaskEnergy
Delivering deep customer insight through UX audits, personas, and journey mapping to strengthen service delivery and improve understanding across customer touchpoints.
Try selecting different filters to see more projects.
Not sure where to start? Tell us a bit about yourself and your product or project. With over 30 years of experience, we’ve seen it all. No matter what stage you’re in, we’ll find a way to help or guide you to someone who can.
Contact arrow_forward arrow_forward Book Meeting arrow_outward arrow_outward