

The Government of Saskatchewan, comprising over 20 ministries and 12,000 employees, serves more than 1 million citizens who call the beautiful province of Saskatchewan home.
For years, Saskatchewan's economic, health, education, and agricultural data lived in disconnected systems across ministries. Each department managed its own reporting processes, often relying on manual workflows to validate, aggregate, and publish information. By the time data reached the public, it was frequently outdated, difficult to interpret, or inaccessible outside of static PDF reports. Citizens had no single place to go for accurate government information, and ministries had no shared infrastructure to publish it efficiently.
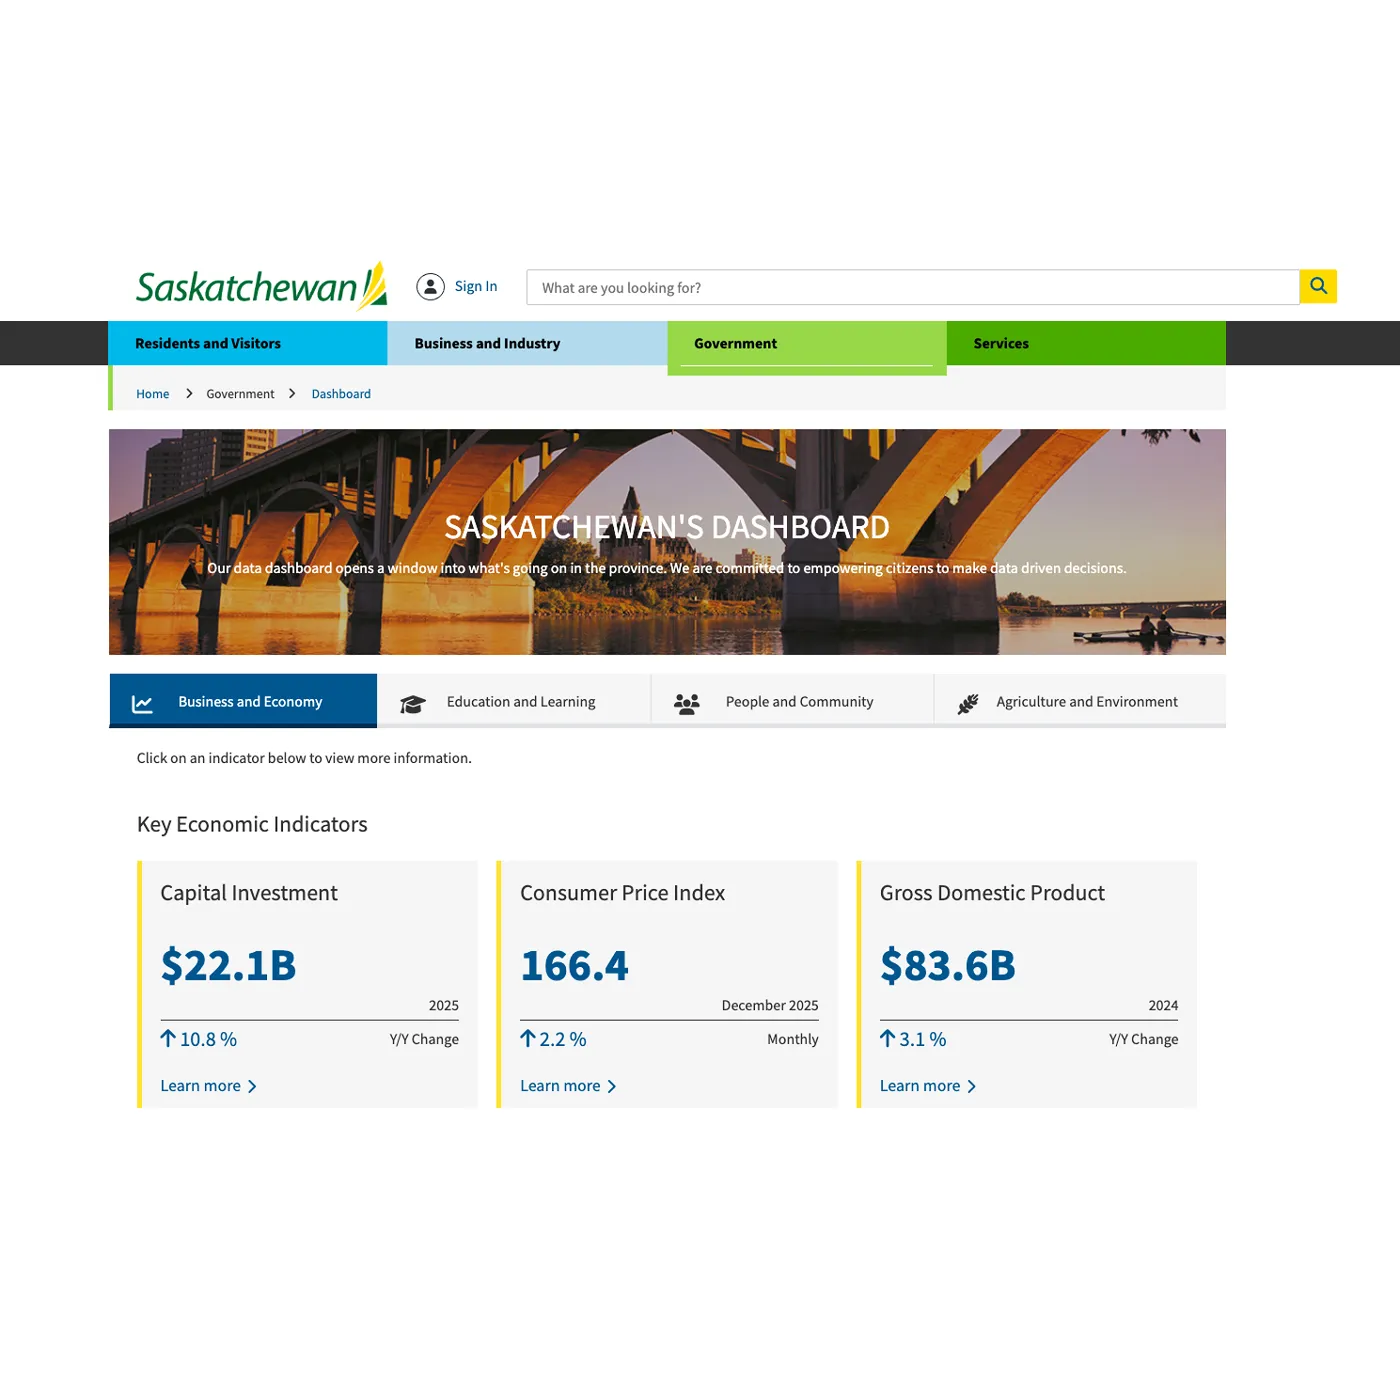
In 2016, the Ministry of Economy approached zu with a specific problem: how to make economic data accessible to the public without creating unsustainable reporting overhead. But the challenge extended beyond a single ministry. Saskatchewan needed a platform that could serve as reusable infrastructure, capable of absorbing new data sources, new ministries, and shifting public information needs without requiring a rebuild each time. The system had to be designed for growth from the start, not retrofitted later.
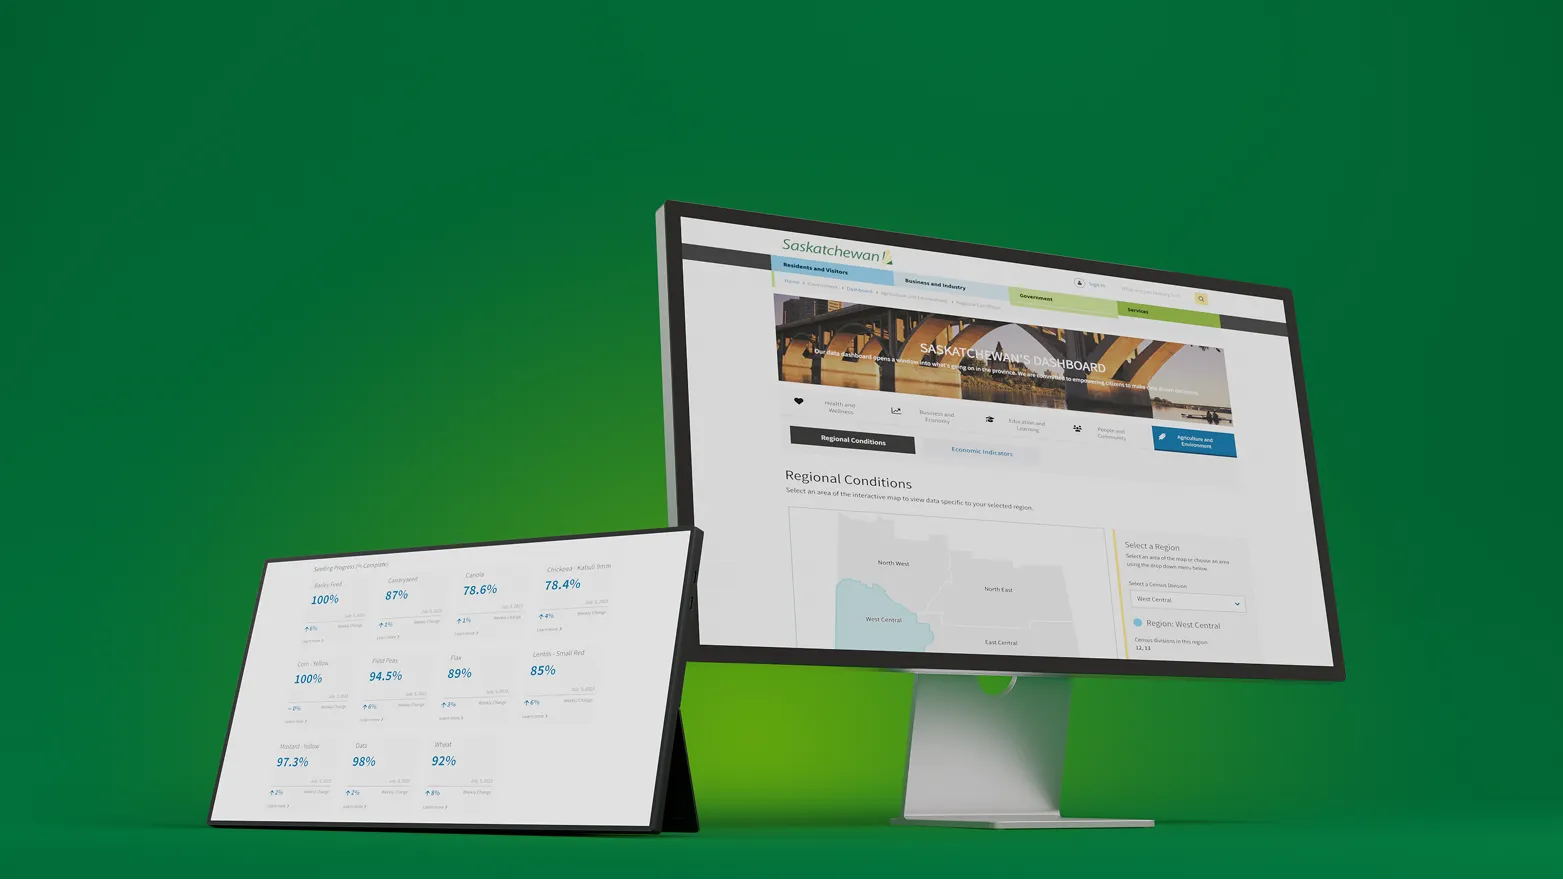
zu co-designed the Saskatchewan Dashboard as a single-page web application built to scale indefinitely. The architecture was intentionally open-source and API-driven, allowing ministries to connect their existing databases without migrating data or overhauling internal systems. Each ministry could plug into the platform, map their datasets to a standardized interface, and publish to the public through one consistent tool.
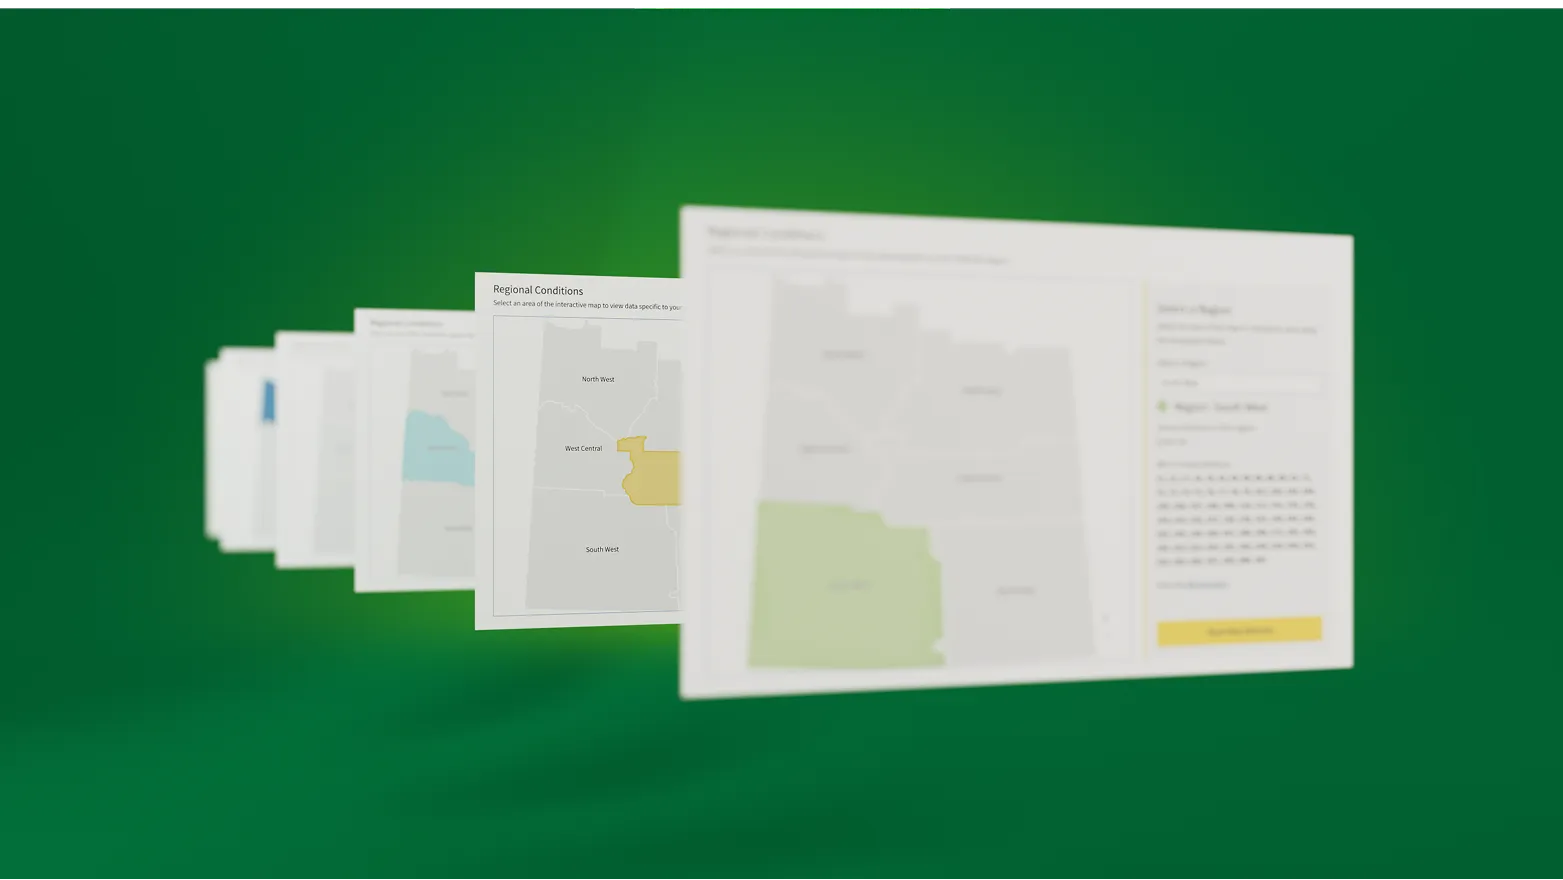
The design prioritized clarity under pressure. Workshops with ministry stakeholders revealed a gap between how government organizes information internally and how citizens actually look for it. zu restructured the interface around user intent, not departmental hierarchy. Information architecture followed accessibility standards (WCAG 2.0 AA) and visual design applied Gestalt principles to make dense datasets scannable and legible. The goal was to reduce cognitive load so citizens could find what they needed without translating government language first.
The platform's design was tested in 2020. When COVID-19 created urgent demand for real-time public health data, the existing dashboard infrastructure absorbed the load. In under four weeks, the system expanded from quarterly economic reporting to daily health updates. It began publishing over 66,000 health data points across 120 indicators, updated seven days a week for nearly two years. This wasn't a new build. It was the same architecture, extended. The API integrations, modular front-end components, and scalable hosting infrastructure that supported economic data in 2016 handled pandemic reporting in 2020 without breaking. During a period of intense public scrutiny, the dashboard became Saskatchewan's primary source for COVID-19 information, proving that infrastructure designed for transparency can adapt to crisis without compromise.
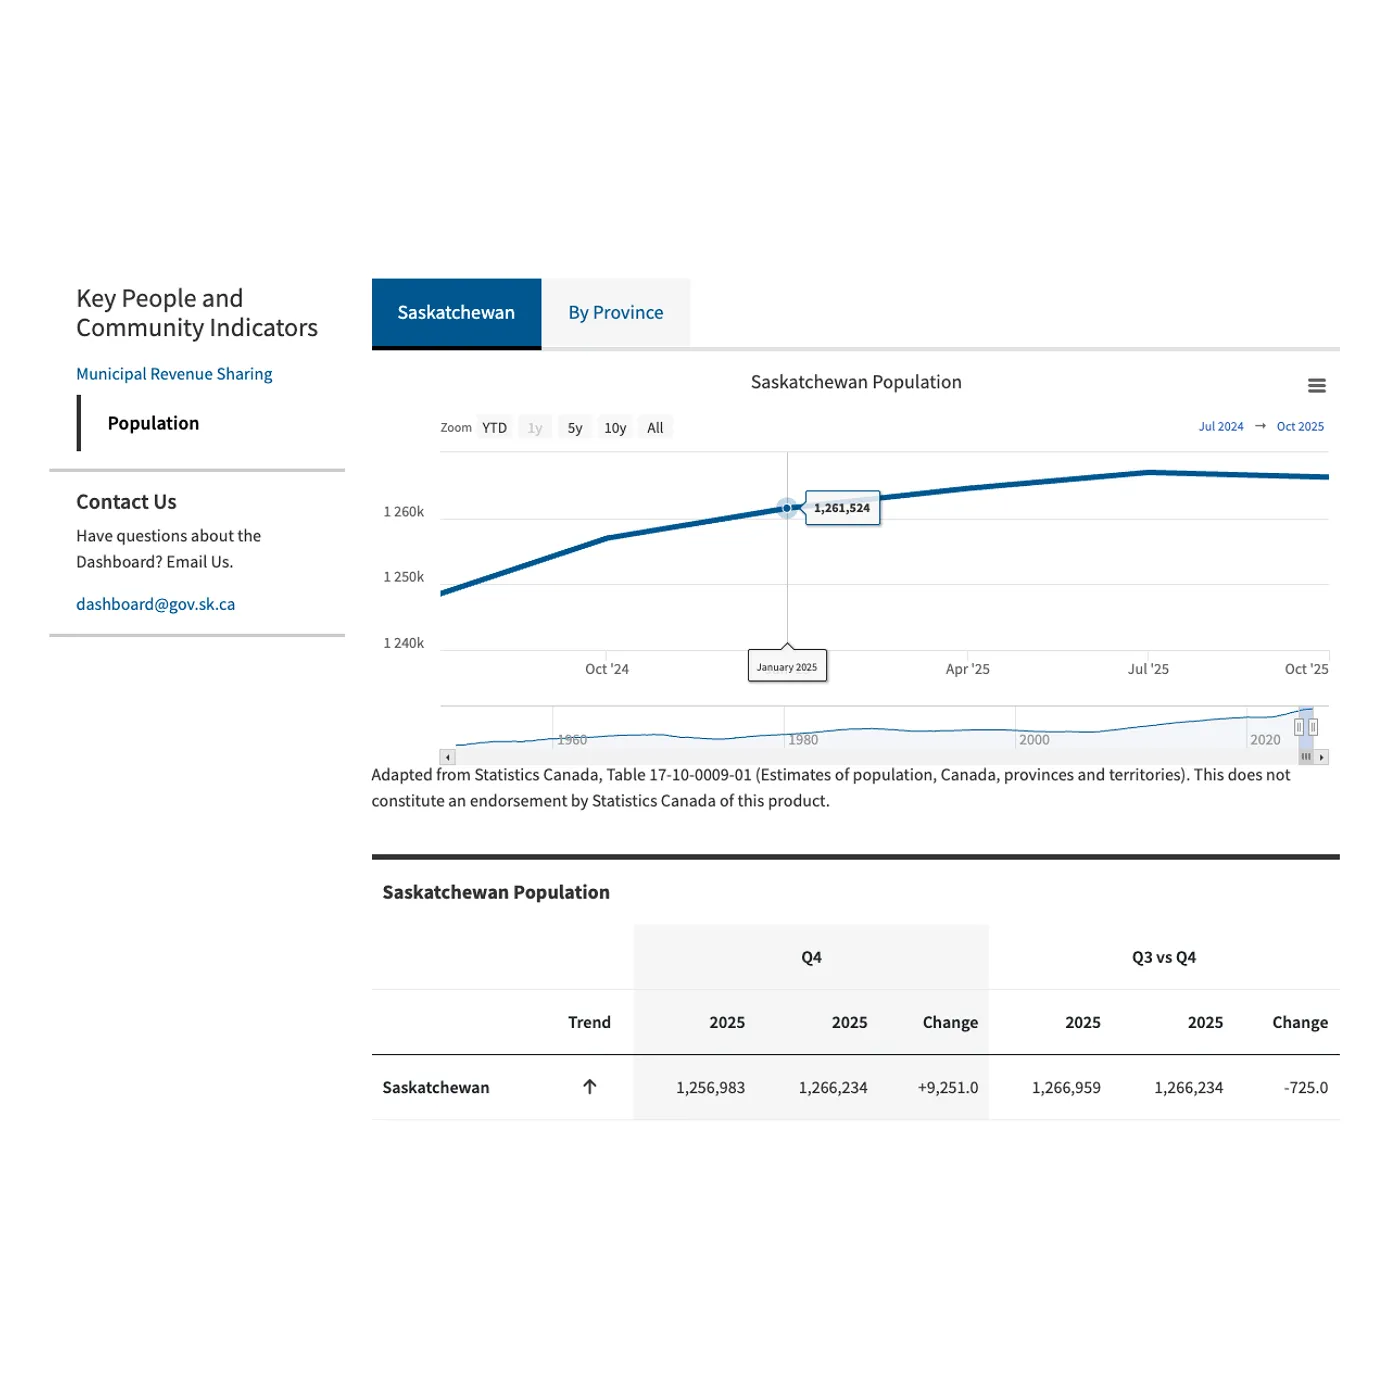
The platform continued to grow beyond health. Education and Learning dashboards integrated post-secondary enrollment and credential data, freeing institutions from proprietary reporting tools. Agriculture and Environment dashboards brought real-time crop conditions, livestock data, and market information to producers across the province. Each new ministry leveraged the same core system, the same API framework, the same design patterns. No duplication. No parallel builds.
Today, the Saskatchewan Dashboard operates as foundational digital infrastructure. It connects multiple ministry databases, reduces manual reporting overhead, and gives citizens one reliable place to access government data. More than that, it demonstrates how designing for reuse from the start turns a single project into a scalable public service. The platform didn't just solve one ministry's reporting problem. It created a model for how government shares information at scale.
Not sure where to start? Tell us a bit about yourself and your product or project. With over 30 years of experience, we’ve seen it all. No matter what stage you’re in, we’ll find a way to help or guide you to someone who can.
Contact arrow_forward arrow_forward Book Meeting arrow_outward arrow_outward